
Okay, so check this out. You open NVIDIA’s technical dashboard and the panels are arguing with each other in real time. The moving-average gauge is flashing strong buy. The oscillator panel shrugs with a neutral.
MACD is leaning bearish. And below all of that, a rectangle formation Investtech flagged sits there waiting for a breakout that hasn’t happened yet. Four signals, one stock, all visible at once, and none of them agreeing.
That’s not a broken dashboard. That’s the dashboard working correctly, and it’s exactly the kind of thing we at GeekExtreme can’t leave alone, because a technicals widget is basically a spec sheet for price behavior, and reading spec sheets is our whole personality.
Here’s the discipline this piece will teach you, up front: every number on that screen is a snapshot, not a property of the stock. RSI sat in the mid-40s in the August pre-earnings window; by late September it read 59.36. The 50-day moving average was near $207 in August and $215.11 by late September. NVDA closed at $228.87 on September 22 and $224.58 on September 24.
Same chart, different days, different meanings, that’s the whole game of stock chart analysis. So we’re going to pop the dashboard open panel by panel, date-stamp everything, and figure out why the headline gauge can disagree with its own components.
Key Takeaways
NVDA’s technical ratings in late September 2026 read daily buy, 1-week buy, and 1-month strong buy, but those are condition-checks across indicators like MACD and Ichimoku Cloud, not advice.
The same indicator said different things weeks apart: RSI in the mid-40s in August versus 59.36 in late September, and the 50-day MA moving from about $207 to $215.11.
The fundamentals underneath the chart are strange: $96.2B fiscal Q2 revenue at a 75% gross margin, but only $21.3B of free cash flow, with earnings set for November 17, 2026.
What the NVDA stock chart dashboard actually displays
A stock chart plots price on a vertical axis against time on a horizontal one, usually rendered as candlesticks that show open, close, and range for each period, with volume bars underneath and a timeframe selector (daily, weekly, intraday) to change the zoom. That’s the core of it. Everything else is layers on top.
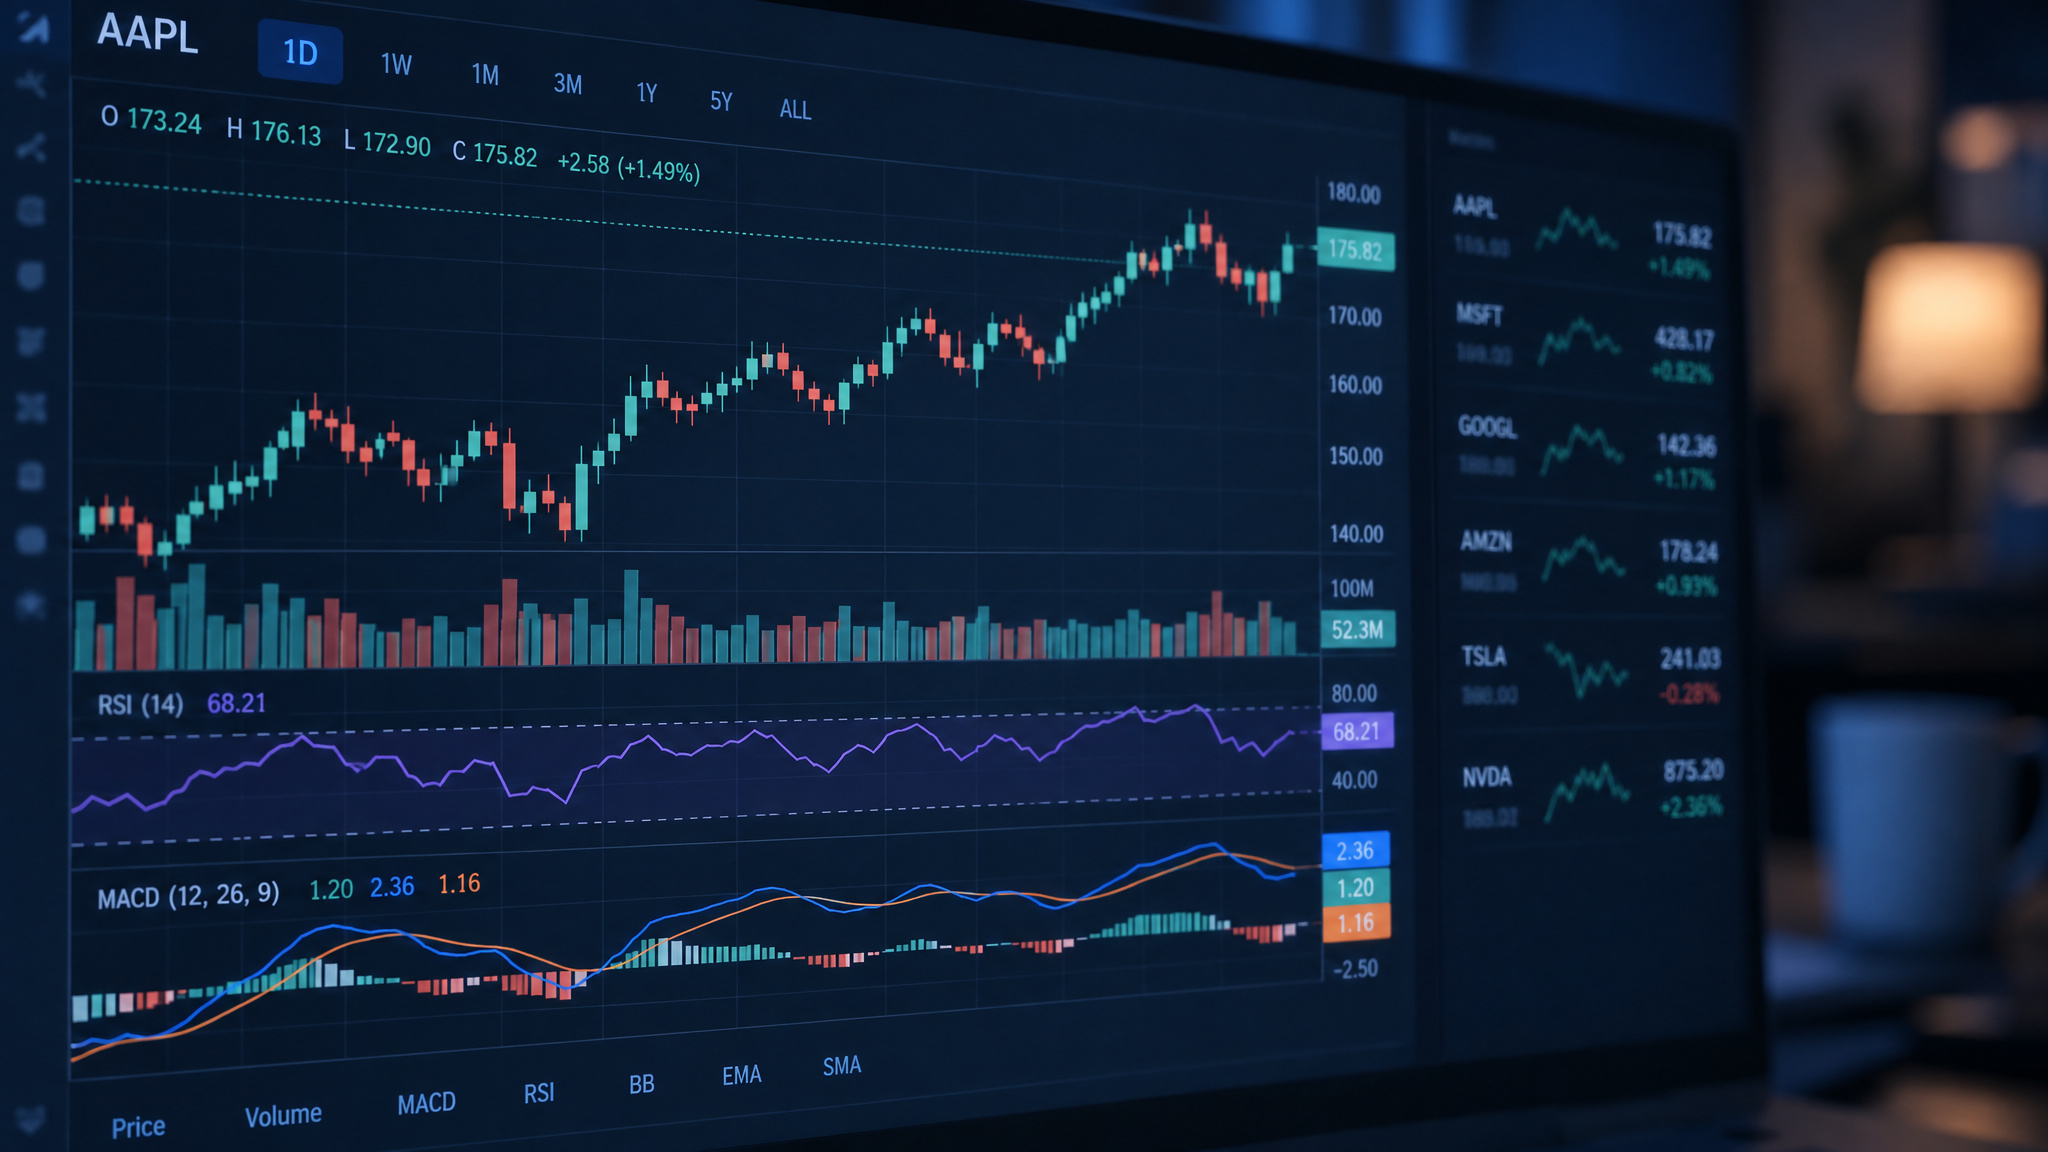
The NVDA dashboard layers on plenty: eleven oscillators, fourteen moving-average rows, and five pivot systems. There’s a summary gauge at the top that rolls up moving averages, oscillators, and pivots into a single buy/sell/neutral signal. It’s a quick summary signal, not a verdict on its own. Below that sit the individual panels, each with its own indicator roster.
For grounding, the 52-week range runs 164.27 to 236.54, and the two recent closes were $228.87 on September 22 and $224.58 on September 24. You don’t need a candlestick tutorial to work with this; you need a map of the panels. So here’s the map.
The summary rating: how one gauge aggregates many signals, and where it breaks down
NVDA’s technical ratings, as of the late-September snapshots this article is built from, read daily buy, 1-week buy, and 1-month strong buy. Those are condition-checks, not advice. The gauge is saying certain indicator conditions fired, nothing more.
The aggregation layer is the interesting part. The Technical Ratings tool combines several indicators’ ratings, including the Ichimoku Cloud and MACD among its inputs, into one combined gauge meant to flag potentially profitable setups. Each panel underneath is basically a vote count: the oscillator panel counts how many of its indicators read buy, sell, or neutral and tallies them, and the moving-averages panel does the same thing with different inputs. The gauge at the top is the rollup of those votes.
Here’s where it breaks down, and this is the part worth sitting with. The gauge looks most decisive exactly when its own components disagree. On Investtech’s page, NVDA showed daily buy, 1-week buy, and 1-month strong buy, while the oscillator, moving-average, and pivot tables showed no populated values at all.
The counters were empty, with no readings reported. We’re not going to fake a reading off that; the honest interpretation is that the headline ratings were present and the underlying values weren’t, and you can’t verify the vote count if the ballots aren’t visible.
The same stock, in the same period, also carried a bearish MACD posture and a pending rectangle breakout on the same screen as that strong-buy rating. The aggregation layer flattens all of that into one confident-looking signal. That’s the failure pattern: the smoother the summary, the more disagreement it can hide.
One caveat, stated once and meant: a rating means the indicator conditions were met, nothing more. Combine it with news and fundamentals, and never act on the gauge alone. Also, for the record, none of this is investment advice, and nothing here recommends buying, selling, or holding anything.
Oscillators in practice: what RSI and MACD said about NVDA, and when
An oscillator measures momentum on a bounded scale and flags overbought or oversold when the reading pins at an edge.
NVDA’s oscillator panel runs eleven of them, and the roster itself is worth reading like a spec table:
- RSI (14)
- Stochastic %K (14, 3, 3)
- Commodity Channel Index (20)
- Average Directional Index (14)
- Awesome Oscillator (yes, that’s really its name, and kind of elegant for what it does)
- Momentum (10)
- MACD (12, 26)
- Stochastic RSI Fast
- Williams %R
- Bull Bear Power
- Ultimate Oscillator (7, 14, 28)
NVDA’s overall oscillator rating read neutral in the snapshot period, no drama there, so let’s move on.
RSI, two dates
Quick refresher on the tool itself: the Relative Strength Index (14) is an oscillator that builds bands between two extreme values, high and low, and fluctuates within them, it’s used to see if an asset is oversold or overbought. RSI sat in the mid-40s in the August pre-earnings window, and CNBC’s read at the time was that it was far from oversold, meaning room to fall. By late September it read 59.36, with price above both major moving averages: positive momentum without an extreme. Same indicator, different dates, different meaning. Neither reading predicted what happened next, and we’re not claiming it did.
Kill the recurring misread while we’re here: RSI below 50 is not a sell signal. Readings are snapshots paired with trend context, not properties of the stock. The needle moved from the mid-40s to 59.36 in about six weeks, which is exactly why date-stamping matters.
MACD
NVDA’s MACD crossed below its signal line while remaining above the 0-line, per CNBC Investing Club’s August analysis. That combination points bearish, pending confirmation. The above-zero detail changes the meaning: below-signal-line while still above zero is a lean, not a collapse. The indicator is leaning, not shouting.
Moving averages: NVDA’s trend spine and why the levels move
A moving average is a price-based, lagging indicator, an average of past prices that does three jobs: gauges momentum, confirms trends, and defines support and resistance. EMAs weight recent prices more than SMAs; that’s the whole EMA-versus-SMA distinction in one clause.
NVDA’s panel runs fourteen rows: EMAs and SMAs at 10, 20, 30, 50, 100, and 200 periods, plus Ichimoku Base Line (9, 26, 52, 26), Volume Weighted Moving Average (20), and Hull MA (9).
The NVDA specifics, date-stamped: in late September, price sat above the 50-day MA at $215.11 and the 200-day at $198.85. Both averages below price is the clean takeaway. But the 50-day itself was near $207 in August. That’s the teaching point: “support at the 50-day” is a moving target, so date-stamp it every time. The panel’s strong-buy rating reflects trend confirmation, not prediction.
Support, resistance, and the pivot table: formulaic levels vs the levels traders actually watch
NVDA’s dated support ladder had three rungs with three distinct meanings: $207, which was the 50-day MA at the time; $200, the break level; and around $195, where the 200-day MA and the uptrend from the March low converge. A ladder, not a floor. Overhead, resistance sat at $233 to $237, including the 52-week high of $236.54, only about 3% above the September 22 close.
Then there’s the pivot table, which computes levels from prior price action where traders expect continuation or reversal. The widget calculates them five ways: Classic, Fibonacci, Camarilla, Woodie, and DM, across R3 through R1, the pivot, and S1 through S3. And here’s the honest observation: the levels traders actually cited for NVDA came from moving averages and a trendline, not a pivot formula. That’s why pivot tables often get ignored.
Investtech also flagged a developing rectangle, price coiling between roughly parallel levels, where a break upward triggers a buy signal and a break downward a sell signal, plus a rising-trend read and price holding above support, a level some investors would treat as a buying opportunity on a pullback. That’s their reasoning, reported, not endorsed. And to be clear, we’re not claiming any level held or broke.
Reading NVDA’s pullbacks: volume and volatility in action
NVDA’s 5-year beta of 2.22 means it swings roughly twice as hard as the market, and the chart proved it: the stock fell over 7% across a seven-day losing streak while the Nasdaq dropped only about 3%, after topping out at its highest close since mid-May on August 13.
The volume read is always relative to its average. On September 22, volume was 95.7M shares against a roughly 133M 20-day average, per INDmoney. A separate Yahoo snapshot showed 29.6M against a 126M average. Different sources, different days; attribute each, don’t blend them.
The pattern is the same either way: below-average volume on a decline reads differently than heavy distribution. It’s a quieter tape than the average implies, and quiet selling is a different animal than a stampede.
Side note: short interest sat around 1.24%, meaning little of the float is positioned for a decline. The caveat: shorting isn’t the only way investors express doubt, so the number doesn’t capture every skeptic.
Why NVDA’s chart moves differently: AI sentiment, earnings, and the fundamental layer
NVDA’s chart reacts to AI-ecosystem sentiment the way most large caps react to their own earnings, which is why a buy rating and a 7% weekly drop coexisted. The August slide’s drivers: data-center political pushback, memory bottlenecks raising per-gigawatt compute costs (a hardware constraint, and this audience gets supply-chain bottlenecks instantly), and falling token costs threatening OpenAI and Anthropic’s financial obligations. Cheaper inference is good for users and awkward for the labs’ balance sheets. Weird feedback loop.

The “central bank of AI” framing is a mechanism others use: Nvidia takes stakes in ecosystem members and helps arrange data-center financing, hence Jensen Huang’s “AI Fed chair” nickname. The circularity is stated plainly here, no insinuation. The accounting quirk that matters for chart readers: chips-for-equity deals add revenue without generating cash, so free cash flow is the useful cross-check.
Catalysts: earnings land on November 17, 2026, with Q3 revenue guided at $108B plus or minus 2%, and that guide assumes zero China Data Center compute revenue, an assumption worth keeping in view. Around catalysts, results and guidance outweigh chart levels.
When the chart disagrees with the fundamentals
Technicals serve timing and risk; fundamentals drive the thesis, and after earnings the results outweigh the chart. The tension, in numbers: fiscal Q2 revenue of $96.2B, up 106% year over year, with Data Center at $89.0B (about 92.5% of the total) at a 75% gross margin, versus free cash flow of only $21.3B. That $59.7B GAAP net income versus $21.3B FCF gap is the observation that matters, and part of the gap is legible: net income included roughly $7.8B of equity-investment gains, so some of that profit came from sources other than chip sales. Receivables hit $63.1B with collection time risen to 60 days on extended terms for large orders.

Margin guidance eases from 75% to about 74% in Q3 and 71 to 72% in Q4, attributed to rising memory costs. And the concentration numbers, grouped: one direct customer at 16% of Q2 revenue; commitments jumped from $119B to $279B in a single quarter; $108.5B maximum gross exposure under guarantees, much tied to a phased future data-center project.
Three open questions worth watching: can Nvidia protect its margins, will revenue become cash promptly, and who ultimately pays for the AI buildout. Read the numbers honestly; no accusations required.
Valuation and analyst expectations as the chart’s backdrop
Valuation is the backdrop the chart sits in front of, and it’s the layer with the least implied cushion: fundamentals look strong, but the multiples and the analyst targets point in different directions. Same rules as the technical panels: date-stamp everything, and let the numbers and the targets sit in tension instead of forcing a verdict.
What the multiples say
The answer depends on which denominator you trust. Trailing P/E runs about 28.4 to 28.9x, forward P/E about 19.0 to 24.9x on different estimate bases, price/FCF is 43.5x, FCF yield 2.3%, PEG 0.48. The contrarian output: a DCF on three years of analyst estimates yields about $174 per share (Investors Grow), even though forward P/E around 21x sits below the 20-year average of roughly 25 to 26x. Two facts pointing different directions. We’re holding the tension, not resolving it.
Targets and scenarios
Eight named targets, from $275 to $400:
| Analyst | Firm | Target | vs Sep 22 close |
|---|---|---|---|
| Rasgon | Bernstein | $400 | +75% |
| Cassidy | Rosenblatt | $390 | +70% |
| Arya | BofA | $350 | +53% |
| Schulze-Melander | Redburn | $325 | +42% |
| Schneider | Goldman | $300 | +31% |
| O’Connor | Piper | $300 | +31% |
| Bolton | Needham | $300 | +31% |
| Lenschow | Barclays | $275 | +20% |
The average sits around $329 across 61 analysts, about 44% above the September 22 close. The scenario math is where it gets sobering: $450B revenue at 45% margin and 18x yields $150; $550B at 48% and 22x yields $239; $690B at 52% and 26x yields $384. But even 70% growth with 45% margin and 18x yields only about $230, roughly the September 22 baseline of $228.87. Justifying that price takes about $527B of FY2028 revenue (roughly 30% growth) at 48% margin and 22x.
The math is tighter than the targets look. Targets are expectations to investigate, not evidence a price gets reached.
Reconciling conflicting systems: two platforms, same stock, same period
Aggregated ratings are condition-checks, not advice, and two professional systems can disagree on the same stock in the same period for honest reasons. Investtech read daily buy, 1-week buy, and 1-month strong buy with a pending rectangle breakout; CNBC’s chart work in the same window flagged a bearish MACD posture and mid-40s RSI. Same stock, same period, opposite reads.
The lesson is methodology and timeframe differences, not one system being right. Investtech is an automated rules engine, built on pattern recognition, statistical optimization, and behavioral finance, running since 1997. On cost, plainly: the Trader plan runs €399 per year, Professional €799 per year, and Institutional covers 30,000 stocks at contact pricing.
Pulling live values: a workflow that survives stale snapshots
Pull live values, date-stamp everything, and cross-check a second system, because snapshots go stale within days: RSI and the 50-day MA both shifted between August and late September, and any static chart article is outdated on arrival. The em-dash placeholder rows on the ratings pages mean you have to check live values rather than trust any article’s numbers, including this one. Ratings are not investment advice, and platforms carry their own disclaimers: Investtech’s content falls outside SEC and FSA oversight and isn’t aimed at US or UK consumers. One verification-discipline example: the reported $12.9B Hugging Face acquisition is a single-source, unverified headline. Interesting, unverified, never stated here as fact.
Where the lenses agree and what to watch next
Fundamentals look strong, valuation has little implied cushion, technicals are constructive (price above both MAs near the 52-week high), and sentiment is stretched: targets from $275 to $400, short interest at 1.24%, room for disappointment. On the product side, the Vera Rubin platform is the next milestone worth keeping on the radar alongside the earnings date. Before the November 17 print, watch four things: is revenue tracking toward the $108B Q3 outlook; are margins following the 74% to 71-72% path; whether customer payments are catching up with sales; and whether management still expects roughly 70% FY2028 growth, preliminary and supply-limited. For grounding: Nvidia is Santa Clara-based, runs Graphics and Compute & Networking segments, and sells into gaming, professional visualization, data center, and automotive. Treat chart ratings as condition-checks combined with news and fundamentals, never as advice.
Frequently Asked Questions
How to read a stock chart for dummies?
Start with the core: price on the vertical axis, time on the horizontal, usually candlesticks showing open, close, and range per period, with volume bars underneath and a timeframe selector to change the zoom. Everything else — moving averages, oscillators, pivot tables — is a layer on top. Treat every number as a snapshot tied to a specific date, not a permanent property of the stock.
What do the moving averages on the NVDA chart mean?
A moving average is a lagging, price-based indicator that gauges momentum, confirms trends, and defines support and resistance. In late September, NVDA’s price sat above the 50-day MA at $215.11 and the 200-day at $198.85 — both averages below price is the clean trend-confirmation read. But the 50-day was near $207 in August, so ‘support at the 50-day’ is a moving target you should always date-stamp.
Why is Nvidia stock going down today despite a buy rating?
Because technical ratings and price can move in opposite directions — NVDA’s chart reacts to AI-ecosystem sentiment the way most large caps react to their own earnings. The August slide was driven by data-center political pushback, memory bottlenecks raising per-gigawatt compute costs, and falling token costs threatening the financial obligations of AI labs. A buy rating means indicator conditions fired, nothing more; it doesn’t immunize the stock against sentiment shifts.