
A profitable company looks at its income statement, sees healthy revenue and a nice margin, and then someone in the room asks the question that ruins the morning: where did the cash go? It sounds like a paradox, but it’s one of the most common failure patterns in business, and CLA, the accounting and advisory firm, points out that most cash crunches happen because cash timing problems stay invisible to leadership until they’re already doing damage, not because the business is unprofitable. That question is exactly what pushes companies toward a rolling 13-week cash flow forecast, and, for businesses feeling that squeeze right now, toward liquidity tools like invoice finance in Perth , and once I dug into how this thing works, I got a little obsessed. So, why is cash flow forecasting important to a business?
Because profitable businesses fail from unseen timing, not from bad predictions, and the forecast is the instrument that exposes week-level gaps the P&L structurally hides. The working definition is simple: a cash flow forecast is a projection of the money moving into and out of a business over a coming period, built to manage liquidity, mitigate risk, and inform capital allocation. And if you think this is a niche worry, the 2025 AFP Treasury Benchmarking Survey found cash management and forecasting sit among the top priorities for nearly three-quarters of treasury practitioners, and more than 60% call it their single most challenging task. The people whose job this is say it’s both critical and hard. Which is, somehow, comforting.
Key Takeaways
A cash flow forecast projects money moving in and out of a business week by week, exposing timing gaps that a profitable P&L structurally hides.
The 13-week rolling forecast, updated weekly by dropping the oldest week and adding a new one, is the workhorse format because it always shows the next quarter.
Forecast misses are diagnostics: decomposing error by bias, business unit, and flow type can surface collection delays, data fragmentation, even fraud.
Table of Contents
Profitable on paper, cash-poor in practice
Yes, cash flow determines whether a business survives, because running out of cash sets off a failure cascade that has nothing to do with profitability. Here’s the chain, per J.P. Morgan: insufficient cash leads to late vendor payments, which damage supplier relationships, which can trigger shipment cutoffs, which land you in going-concern territory or bankruptcy. In everyday terms: miss one payment window, and the machine that ships your product stops.

Quick definitions so we’re on the same page. Cash flow is the money that actually enters and leaves a business over a period. A forecast projects those movements before they happen. Positive flow keeps things smooth; prolonged negative flow is the red flag.
OneAdvanced, the finance software vendor, frames it the same way, and the Association for Financial Professionals (AFP), treasury’s professional body, puts cash management and forecasting at the top of practitioners’ priority lists for a reason: this is the gap that sinks otherwise healthy companies. A growing pile of accounting profit with draining cash is exactly the situation a profit projection can’t catch.
The timing-gap mechanism is where it gets interesting. CLA describes a pattern that hits growing manufacturers especially hard: raw materials get bought months before the customer pays, labor costs hit before anything ships, customer payment terms run long, inventory builds up, and seasonal demand swings everything at once. Each driver alone is fine. Together, they’re a cash crunch that the income statement never mentions, because the money leaves the building months before it comes back.
And the gaps can be small in duration and enormous in consequence. Global Banking & Finance gives the example of a customer payment expected Friday that arrives Tuesday. **Three business days. Zero effect on annual revenue.
A large short-term cash gap.** The P&L doesn’t care; your payroll does.
What happens when a business doesn’t forecast
Without a forecast, a business runs real risks of surprise shortages, poor decisions, and stalled growth, because it’s flying blind on the one metric that pays the bills. OneAdvanced lays out the failure modes plainly: higher risk of bad financial decisions, unexpected cash shortages, hindered operations and growth, and cash flow issues sitting underneath the factors that lead to insolvency.
There’s also a two-sided error problem that doesn’t get enough airtime. Global Banking & Finance points out that systematically overforecasting receipts means investing cash that doesn’t exist or repaying debt too early. Underforecasting means idle balances and unnecessary borrowing capacity. Both directions of being wrong cost you, just differently. And it’s not just bias, rising forecast volatility itself pushes treasury teams into defensive postures: holding more liquidity, shortening investment maturities, delaying discretionary outflows, or increasing committed facilities. Optimism bias has a billing address either way.
No doom statistics here, just the mechanism: not knowing your future capital needs makes shortages likelier, and shortages stall everything downstream.
What a cash flow forecast actually unlocks
Cash flow forecasting gives a business the ability to see liquidity problems and surpluses coming while there’s still time to do something about them, and that single capability fans out into uses across funding, investing, compliance, and even fraud detection. Here’s the ranked version, drawn from AFP, OneAdvanced, and J.P. Morgan:
- Capital management. You can’t decide on investing or borrowing without knowing your net cash position. You can’t plan a build if you don’t know your budget.
- Earning more, owing less. Forecasting helps you organize cash assets so spare cash earns something and tight months cost less in interest.
- Timing gaps and gluts. The forecast tells you when surpluses and shortfalls arrive and roughly how big they’ll be, which drives funding and operating decisions.
- Proactive shortage response. Seeing a dip coming means getting a loan or liquidating an asset on your schedule, not in a panic. Early warning converts emergencies into errands.
- Surplus deployment. Expansion, acquisitions, loan repayment. Same data, and it either saves or makes you money.
- Better debt terms and valuation. A credible forecast makes you look fundable to lenders and shareholders, because you are.
- The non-obvious stuff. Managing currency exposure, meeting compliance obligations like loan covenants and minimum capital requirements, and, via variance analysis, even surfacing fraud. More on that tripwire later.
J.P. Morgan adds the big-project angle: CFOs, treasury, and FP&A (financial planning and analysis, the team that builds the go/no-go spreadsheets) feed time-adjusted cash projections into NPV and IRR analysis for capital-intensive decisions. And forecasts combined with formulas like the Z-score and liquidity ratios act as an early-warning system. The dashboard light comes on while you can still pull over.
A decision only a forecast can time: the 2/10 net 30 math
Cash flow forecasting supports decision-making because some decisions are pure timing calls, and there’s no better example than early-payment discount terms. Say you receive an invoice on 2/10 net 30 terms: 2% off if you pay within 10 days, full amount due at 30.
Now the arithmetic, visibly. The invoice is $100,000. Pay $98,000 within 10 days. You just saved $2,000 for paying 20 days early.
Run that math again: 2% for 20 days annualizes to roughly 37%. This is wild. That’s a 37% annualized return the buyer earns just by paying 20 days earlier, and correspondingly expensive for the seller offering it.
The catch is that taking the discount requires knowing, on day 10, whether you actually have the cash. A forecast that tracks your position can time that decision, it’s exactly the week-level visibility CLA’s 13-week approach is built to provide. A guess can’t. And that’s the decision-making payoff in general: a cash flow forecast shows when cash is coming in and going out, so you know when there’s enough to move early and when it’s better to wait. Flip it around: if you’re the seller, offering the discount gets cash in faster and cuts down payment-chasing, but whether that trade pencils out depends entirely on your cash position, which is exactly what the forecast tells you. Neither side of this deal can be played well blind.
How a cash flow forecast works: structure, methods, horizons
The core answer on cadence: weekly, on a 13-week rolling window. Everything else hangs off that.
Components and the direct vs. indirect method
A full forecast contains the cash balance you start from, the inflows, the outflows, the net figure (inflows minus outflows), the closing balance, plus the assumptions and sensitivity analysis underneath. Inflows cover sales receipts, funding, investments, tax refunds, loans, and grants. Outflows cover rent, utilities, salaries, supplies, and long-term capital spending. You don’t need to memorize the categories; you need the forecast to capture all of them, not just the obvious bills.
CLA’s minimal viable version is four components: opening balance, receipts, disbursements, ending balance. That’s the smallest config that actually works, and the opening balance is the number that has to be reconciled and correct. Garbage in the opening number, garbage everywhere.
Quick test: Before trusting any week’s numbers, reconcile the starting cash balance against the bank — every downstream figure inherits its errors.
There are two routes to the answer. Direct forecasting counts the actual money moving, category by category, from the opening balance to the ending one, which is what suits short horizons. Indirect forecasting starts from net income and adjusts for working-capital and non-cash items. Both are GAAP-acceptable for the cash flow statement, and most companies report indirect, an aside worth having, since it’s why financial statements are important to read carefully: it’s why the statement in the annual report looks different from the direct weekly forecast I’m recommending here. Reporting standards shape the statement; they don’t dictate how you run your internal forecast.
Two classic traps live in this section. First, assuming accounts receivable equals cash. AR is a promise; the forecast tracks actual movement. Second, the number in the banking app and the number in the ledger disagree until you reconcile, because of outstanding disbursements and deposits in flight. Your forecast needs the right one.
The 13-week rolling forecast and other horizons
Here’s the part I find delightful. Thirteen weeks mirrors a quarter. Each week, you drop the oldest week and add a new one. It’s a sliding buffer that always shows the next quarter. Kind of elegant, the forecasting equivalent of a rolling log window that never fills up.
J.P. Morgan calls 13-week planning the essential short and medium-term interval for avoiding shortfalls when liabilities come due, and puts long-range business-plan forecasting at roughly 3 to 5 years, prepared for investors and lenders. Two ends of the horizon, same discipline.
Why 13 weeks instead of a monthly aggregate? Granularity. A monthly number structurally can’t show the week-level timing of payroll, tax payments, and debt service. A weekly forecast highlights timing risks around all of them, which is precisely the data the P&L throws away. And the way we look at it here, this is the same principle we apply to hardware specs: aggregate numbers hide the interesting failure modes.
One more caution from the scenario-planning toolbox: run the bad endings in a sandbox. What if customers pay 10% late? What if demand drops fast? Run it against the forecast and see how long the cash lasts.

Say the central forecast covers ordinary operations with 90% likelihood, but a 10% receipts delay would force a draw on your revolver, the credit line you treat like an emergency battery pack. Now the vague risk is a specific decision, made before the emergency.
How accurate does it need to be?
Accuracy requirements depend on the forecast’s purpose, and that’s the recommendation, not a caveat. AFP’s guidance: a daily cash-position forecast needs precision; a long-range expansion-capital plan tolerates fuzziness. Weigh the benefit of accuracy against the cost of improving it, the same way you’d pick tool tolerance for a job. And say it straight: forecasts are estimates, not definitive predictions.
Short-term ones miss long-term trends, humans make errors, and even good historical data can’t tame an unpredictable future. That’s fine. It’s a control system, not a crystal ball.
Why forecasts fail: data and process, not math
Most forecast failures trace upstream to the data, not the model, and that’s where you should look first. AFP’s guidance, echoed by Global Banking & Finance, is that many failures originate in fragmented source data: treasury systems, planning docs, accounting, shared services, operating companies. The model isn’t wrong; the data is.
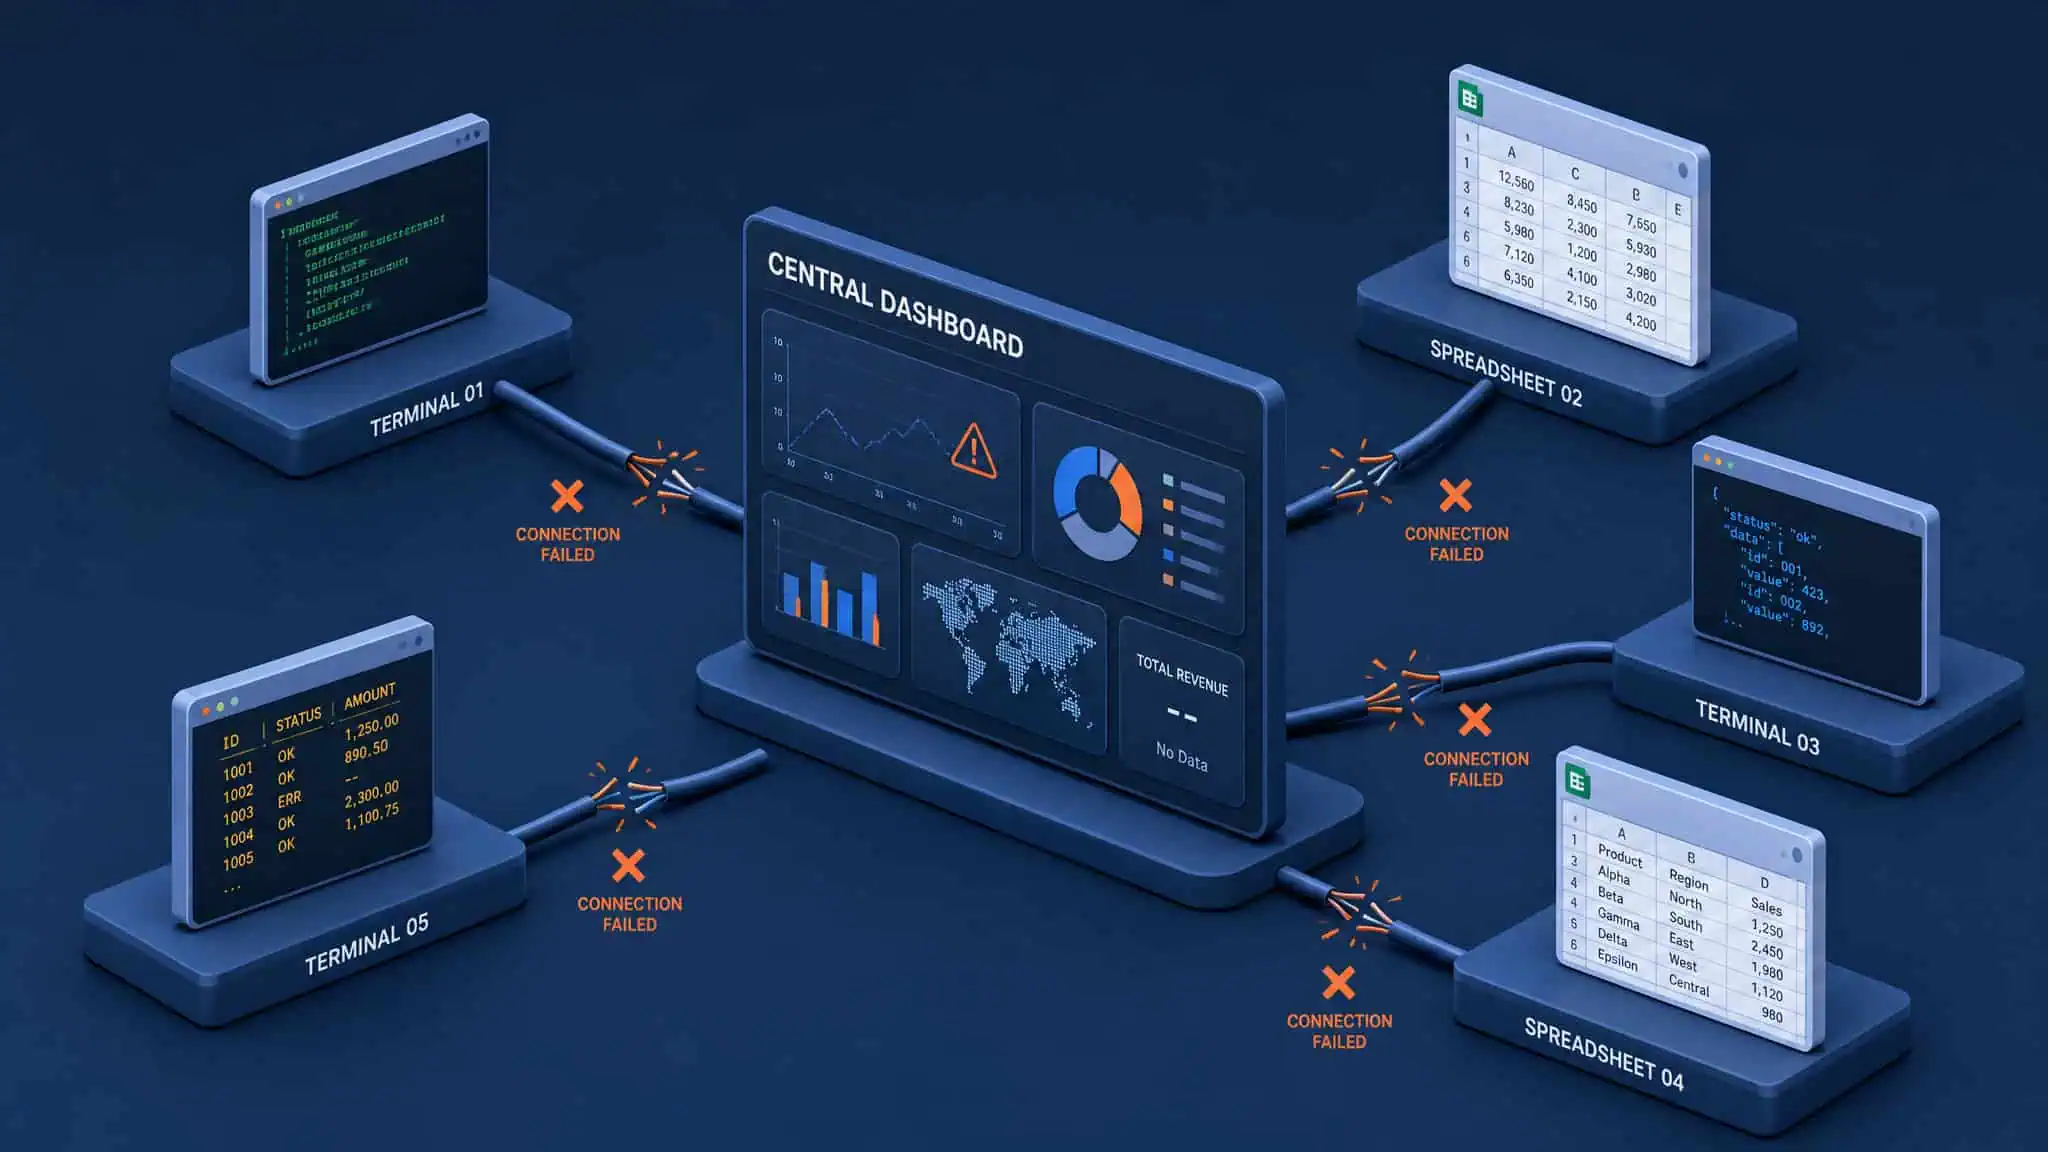
Tipalti, the AP automation vendor, lists the relatable pain points: time-consuming, error-prone manual spreadsheets, leaning too heavily on historical data, disconnected systems, and no visibility into payables. ERP data alone, without AP automation or bank feeds, gives delayed and incomplete cash visibility. The ERP is the system of record for transactions, but it’s not a live cash feed by itself.
The canonical failures are the two traps from earlier: treating AR as cash, and running a forecast off an unreconciled opening balance. Both are upstream data problems wearing a math costume.
Here’s a typical setup that produces mysterious misses: inputs arriving from disconnected systems, each built on different assumptions, feeding one spreadsheet. The error pattern then reveals the source. A tax payment known almost to the dollar, but sitting in the wrong entity’s forecast? The data existed; it just wasn’t wired to the right node.
CapEx approved months early settling differently than treasury assumed? Approval date isn’t payment date, and nobody’s assumption tracked the drift.
Red flag: If forecast misses trace to disconnected systems or an unreconciled opening balance, fix the data feeds before touching the model.
The fix, at least structurally, is the TMS/ERP “single source of truth” idea: a Treasury Management System centralizes cash data the way a home-lab dashboard unifies your feeds. One dashboard everyone trusts beats five spreadsheets that disagree.
Reading the misses: forecast errors as diagnostics
Treat a miss as a signal, not just a wrong number. Forecast error, informally defined, is forecast versus actual over a horizon; there’s no IFRS-defined unit here, so you pick the ruler and keep it consistent.
A single accuracy percentage hides everything. Decompose the error into bias, error growth by horizon, business-unit patterns, and flow types like receivables, payables, tax, payroll, capex, and financing. Read the stack trace, not just the exit code. The patterns point somewhere specific:
- One business unit consistently missing worse than peers? Local receivables behavior or submission discipline.
- Error spiking at month-end? Accounting-to-cash timing.
- Error concentrated in one currency or entity? A structural cash visibility problem.
And then there’s the AFP angle that almost nobody lists: variance analysis comparing actual to projected flows surfaces unanticipated inventory changes, collection delays, payment mistiming, and fraud or embezzlement. The forecast doubles as a tripwire. A number that’s wrong in a way you can’t explain is telling you something.
Separate forecast quality from forecast certainty, too. The right questions are whether the error fell inside the expected range and whether the organization responded appropriately. A good forecast can miss; what matters is the miss being within tolerance and the reaction being right.
One honesty beat: some commentary suggests forecast error will become a formal risk metric across more companies, but no universal standard requires that, and the evidence doesn’t establish it. Speculation is speculation, even when it sounds like a trend line.
The forecast beyond finance: lenders, investors, and compliance
Lenders and investors read the forecast because the discipline itself signals operational quality. Sometimes the forecast exists because the rules say so: AFP notes forecasting is nearly always part of internal control procedures for loan covenants, minimum capital requirements, and imprest accounts. If your lender requires you to keep this spreadsheet alive, that’s fine. It’s doing useful work anyway.
Beyond the requirement, forecast reliability is soft information for lenders, per Global Banking & Finance: it informs revolver sizing, covenant headroom, and liquidity discussions. It’s not a credit score, but persistent error quietly reshapes those conversations. And with borrowing expensive, per the OECD’s Global Debt Report 2026, a miss that forces emergency borrowing has a real price tag now. Misses used to be nearly free. Not anymore.
OneAdvanced adds the investor side: positive projections enhance the ability to attract financing and credit, and shareholders get a view of current and projected performance. Investors should also distinguish economic cash surprises, like deteriorating collections or inventory build, from timing effects that reverse. One is a problem; the other is noise.
The macro backdrop says lenders are watching the same pressures. The ECB’s July 2026 Bank Lending Survey found loan demand driven by working capital, large-firm investment, and refinancing, and the Fed’s July 2026 Senior Loan Officer Opinion Survey showed stronger commercial and industrial loan demand from large and middle-market firms. Lenders see the cash-timing squeeze from their side of the glass.
Technology’s role: what automation fixes and what it cannot
Automation improves speed and pattern recognition; it cannot make uncertain cash flows certain. That’s the decisive difference, and both halves matter.
What AI and automation actually improve
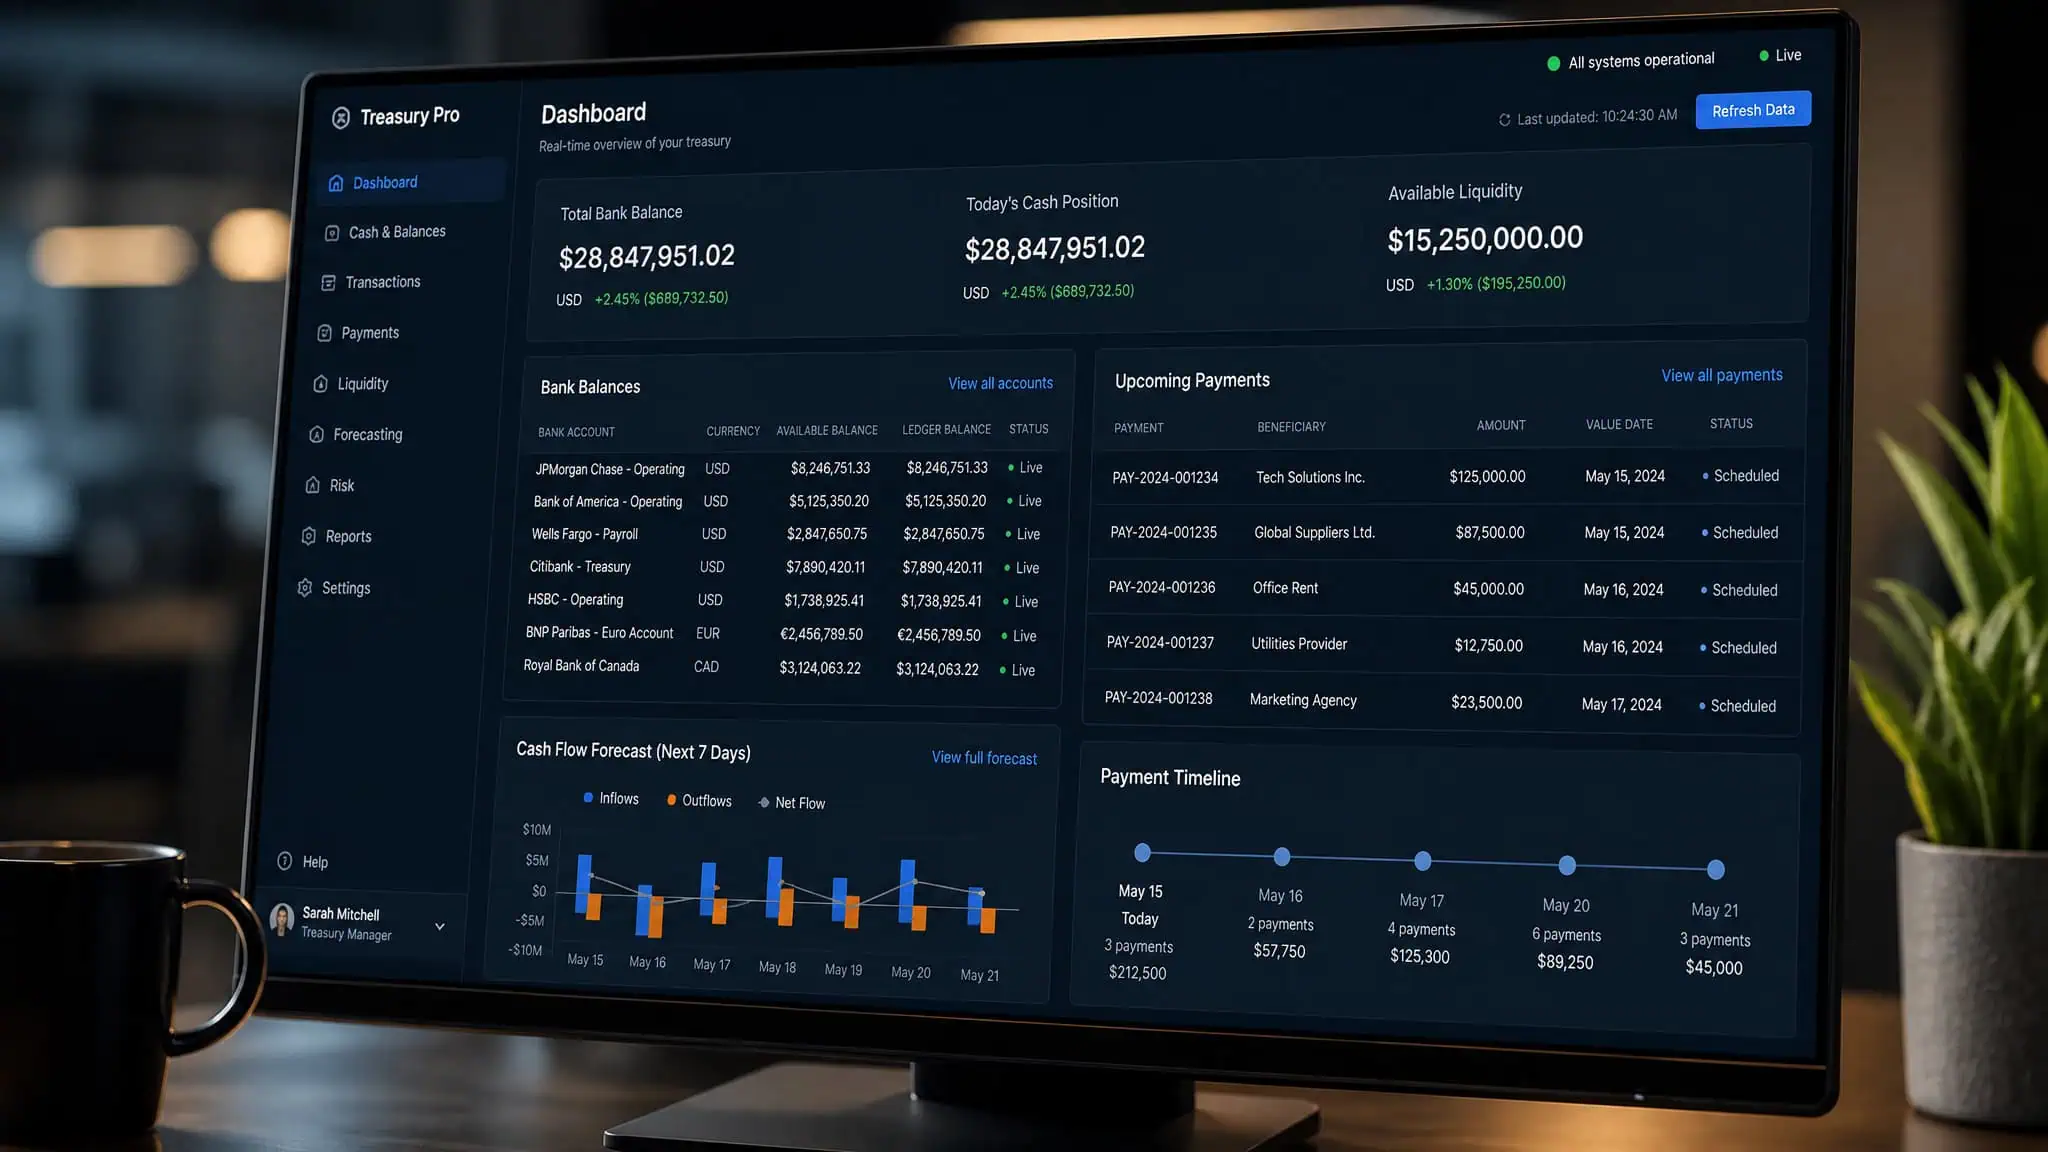
Per Tipalti’s own claims, vendor-reported and unverified by me: machine learning predictions on historical data, real-time inputs and visibility, and cash anomaly recognition with notifications. That’s specific and reasonable. Integrating AP automation, mass payments, and bank data with the ERP creates a continuous real-time view, and automating high-volume outbound payments stabilizes outflow timing. Less jitter in the signal, tighter forecast. If you don’t know when the big payment batch goes out, your forecast lies to you.
As a tool-category example, Statement Treasury pulls bank data and ERP inputs together with AI-driven analysis in a single view, and automates the 13-week forecast, integrating with QuickBooks, NetSuite, and Sage. Describe, not endorse. AFP’s guidance lands the same point for bigger orgs: TMS/ERP centralization gives a single source of truth. And your bank can plug into the loop too, with real-time balance feeds, virtual accounts (which slice one master account into logical sub-accounts, basically VLANs for money), receivables matching, and payment analytics. Your bank might already have the API endpoints your forecast needs.
My favorite maker story here: ASML, the Dutch company that builds the machines the entire chip industry depends on, had a labor-intensive, error-prone manual process for forecasting FX exposure, the currency-driven swings in cash. Their treasury team worked with data-science colleagues to build an in-house AI model for it. Annoying manual process, clever automation, real payoff in time and protected work. Company-reported and bounded to FX exposure, not total cash forecasting, but it’s the right shape of story.
Where automation falls short
The recurring implementation pattern: a team adopts an AI tool expecting accuracy to improve automatically, then discovers the tool is only as good as the fragmented bank, ERP, and AP data feeding it. Fix the pipes before blaming the model. Global Banking & Finance frames automation’s best role as faster probability estimates and learning where forecasts fail, and the strongest systems combine deterministic items, like scheduled debt service, payroll, and tax dates, with behavioral estimates to produce outcome distributions rather than single numbers.
So the test for any tool: does it expose model confidence and error over time, and is it paired with reconciled data? If the pitch is certainty from software, walk away.
Making it stick: policy, people, and the weekly rhythm
Yes, it’s worth starting small, and honestly it fits anyone who can spare 30 minutes, though I’ll be upfront: most of the published guidance skews toward treasury teams and manufacturers, so some of it translates loosely to, say, a five-person services shop. The core moves still hold.
A forecasting policy and cross-unit collaboration
AFP recommends writing down a forecasting policy: goals, frequency, format, update schedule, methods, variance analysis, and how FX gets handled. It’s the README for your forecast. Boring, and exactly why it works.
Accuracy also depends on collaboration across Payroll, AR, AP, tax, and FP&A, with common terminology and shared assumptions. Your forecast is only as good as the group chat. The knowledge is distributed: sales knows receipts, procurement knows supplier timing, tax knows statutory payments, HR knows payroll. Treasury is where all of it merges into one cash view; someone has to be the merge function.
Design for your users, too. Different teams read different layers of the same dataset: supply chain wants liquidity needs, operations wants readiness and upcoming changes. And understand favorable variance as well as unfavorable. Good news you can’t explain is still a bug, because today’s happy surprise is next quarter’s trap.
The weekly operating rhythm
CLA’s recommended loop: assign ownership for inputs and assumptions, update weekly, compare forecast to actual, analyze variances, and adjust. The maintenance loop. Weekly deploys for your cash. And forecasting for the lender and running the business should be the same process, not two documents that disagree.
Starter inputs: your opening cash position, receipts from your biggest customers, payroll, the major vendor payments coming due, debt, and taxes. That’s it. CLA suggests 30 minutes this week to build the first two weeks of a forecast, and I love this advice, because it’s the tiny first commit that beats planning the perfect system.
The closing reframe is CLA’s, and it’s the right one: the goal is earlier, better decisions, not a perfect spreadsheet. The forecast’s job is exposing timing the P&L hides. Accuracy is a cost/benefit choice matched to purpose. Misses are diagnostics.
The discipline is organizational. Judge it as a control system, not a crystal ball, and it stops being intimidating and starts being what it actually is: a monitoring dashboard for money, one week at a time.
Frequently Asked Questions
What are the advantages of using cash flow forecasts?
The big ones: you can see shortages and surpluses coming while there’s still time to act, put spare cash to work, time borrowing so tight months cost less in interest, and respond to a dip on your schedule rather than in a panic. A credible forecast also improves your standing with lenders and investors, and variance analysis can even surface fraud. It turns cash management from firefighting into a monitoring dashboard.
Why is forecasting important for business success?
Because not knowing your future capital needs makes shortages likelier, and shortages stall everything downstream — operations, growth, and the ability to make timely decisions. Some decisions, like taking an early-payment discount, are pure timing calls that only a forecast can time. It’s a control system, not a crystal ball, and control systems are what keep businesses running.
What happens if a business doesn’t forecast its cash flow?
The documented failure modes include surprise cash shortages, poor financial decisions, hindered operations and growth, and cash flow issues sitting underneath the factors that lead to insolvency. There’s also a two-sided error problem: overforecasting receipts means investing cash that doesn’t exist, while underforecasting means idle balances and unnecessary borrowing. Both directions of being wrong cost you.
What’s the difference between a cash flow forecast and a profit projection?
A profit projection tracks accounting income, while a cash flow forecast tracks when money actually enters and leaves the business. A growing pile of accounting profit alongside draining cash is exactly the situation a profit projection can’t catch — raw materials bought months before customers pay, labor costs hitting before anything ships. The P&L doesn’t care that a payment expected Friday arrived Tuesday; your payroll does.
Why do lenders and investors care about cash flow forecasts?
The discipline itself signals operational quality. For lenders, forecast reliability is soft information that informs revolver sizing, covenant headroom, and liquidity discussions — and with borrowing expensive, a miss that forces emergency borrowing has a real price tag. Investors use projections to gauge the ability to attract financing and to distinguish real economic cash surprises from timing effects that reverse.